Solver Output
Mission Results
Instance Library
Every instance from 2 to 7 targets, solved with the exact MILP. Instance n is instance n−1 plus the next body outward, so the series isolates the effect of problem size. Every one was solved to proved optimality, so these are true optima rather than heuristic estimates.
These results are reported in v2 of the preprint, DOI 10.5281/zenodo.22710075, published 11 September 2026.
| Targets | Bodies | Total Δv | Budget | Craft | Horizon | Variables | Solve | Status |
|---|---|---|---|---|---|---|---|---|
| 2 | Mercury, Venus | 46.35 km/s | 50 km/s | 1 | 3000 d | 1,374 | 0.0 s | optimal |
| 3 | Mercury, Venus, Mars | 58.94 km/s | 50 km/s | 2 | 3000 d | 3,360 | 0.2 s | optimal |
| 4 | Mercury, Venus, Mars, Jupiter | 173.87 km/s | 125 km/s | 3 | 6000 d | 8,452 | 4.5 s | optimal |
| 5 | Mercury, Venus, Mars, Jupiter, Saturn | 161.28 km/s | 110 km/s | 2 | 9000 d | 12,780 | 5.6 s | optimal |
| 6 | Mercury, Venus, Mars, Jupiter, Saturn, Uranus | 274.96 km/s | 200 km/s | 2 | 14000 d | 17,250 | 7.3 s | optimal |
| 7 | Mercury, Venus, Mars, Jupiter, Saturn, Uranus, Neptune | 288.22 km/s | 170 km/s | 3 | 20000 d | 24,311 | 9.6 s | optimal |
Total Δv is not comparable across rows as a cost series: the mission horizon and the allowed transfer durations grow with the outermost body, so a larger instance can be cheaper than a smaller one. The rows are comparable for solver scaling, which is what they are here to show.
Mission Timelines
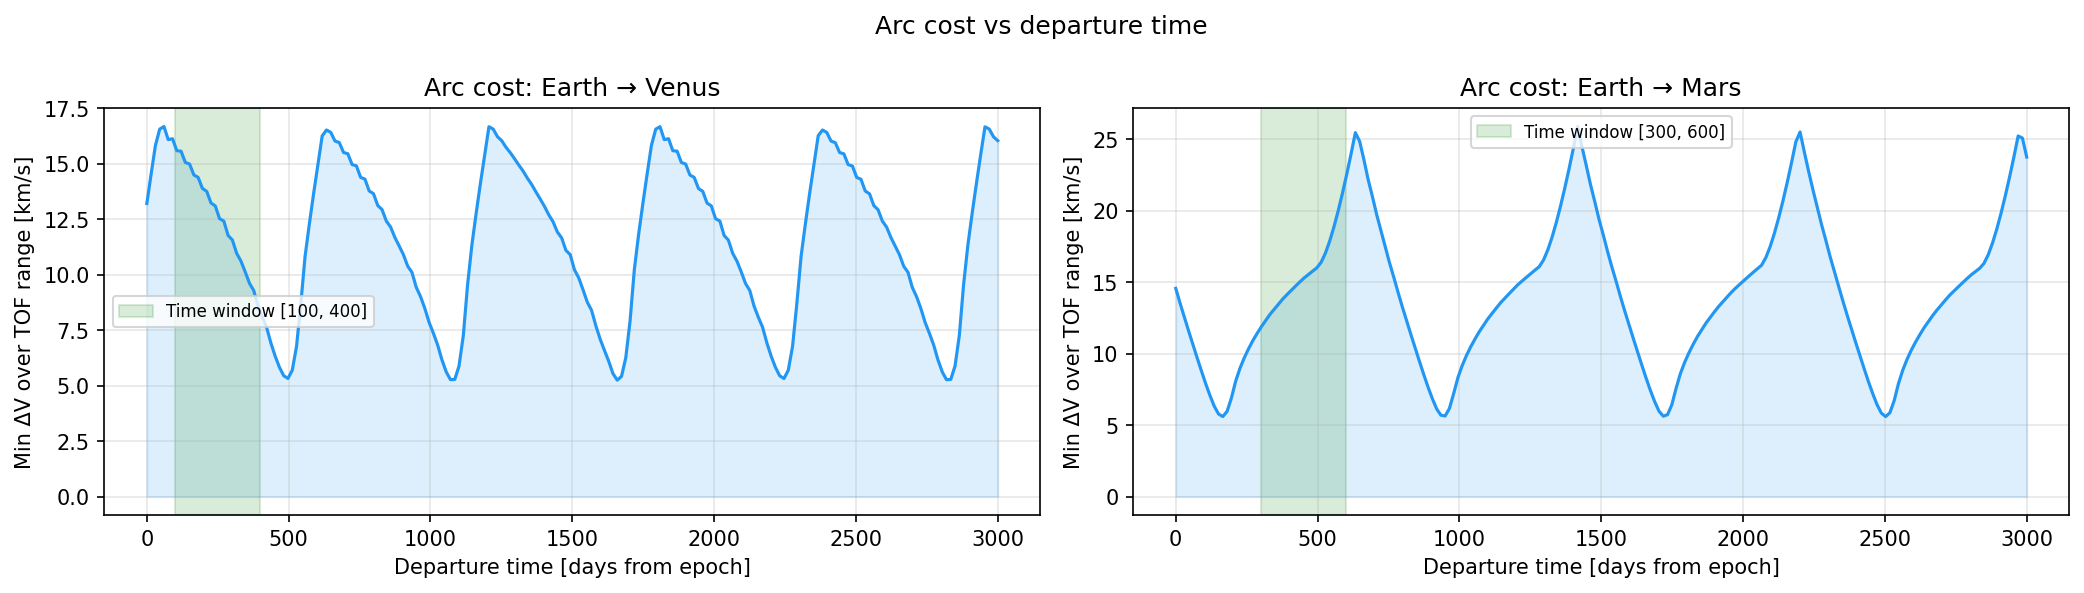
One timeline per instance, drawn from its own solve. Each bar is a transfer leg, so the gaps between bars are stay time: spacecraft waiting at a target for a cheap departure alignment, which is where most of the mission clock goes.
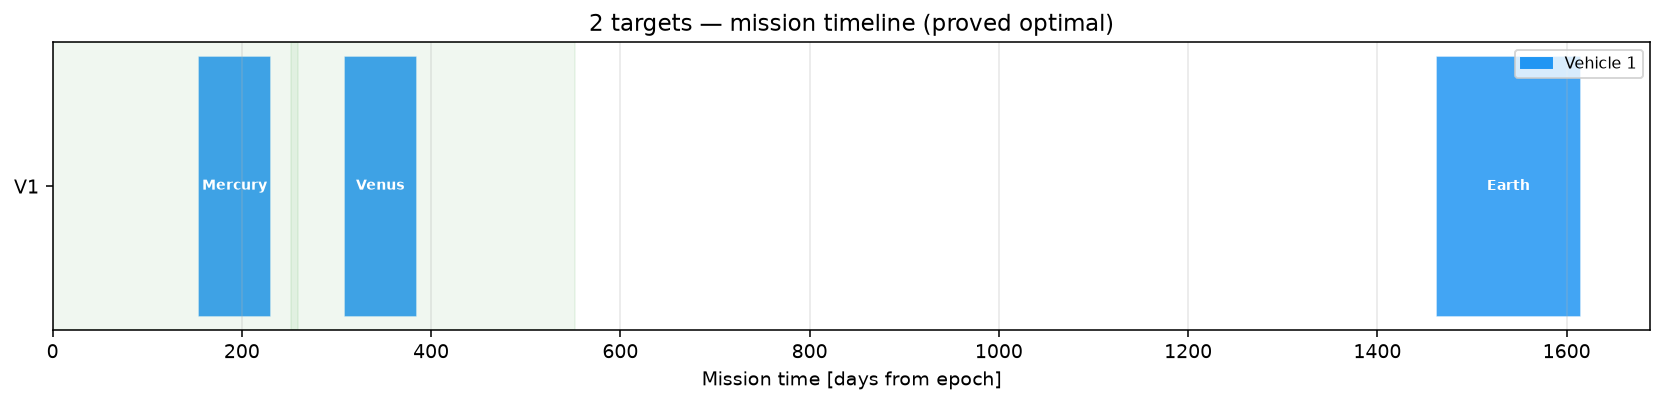
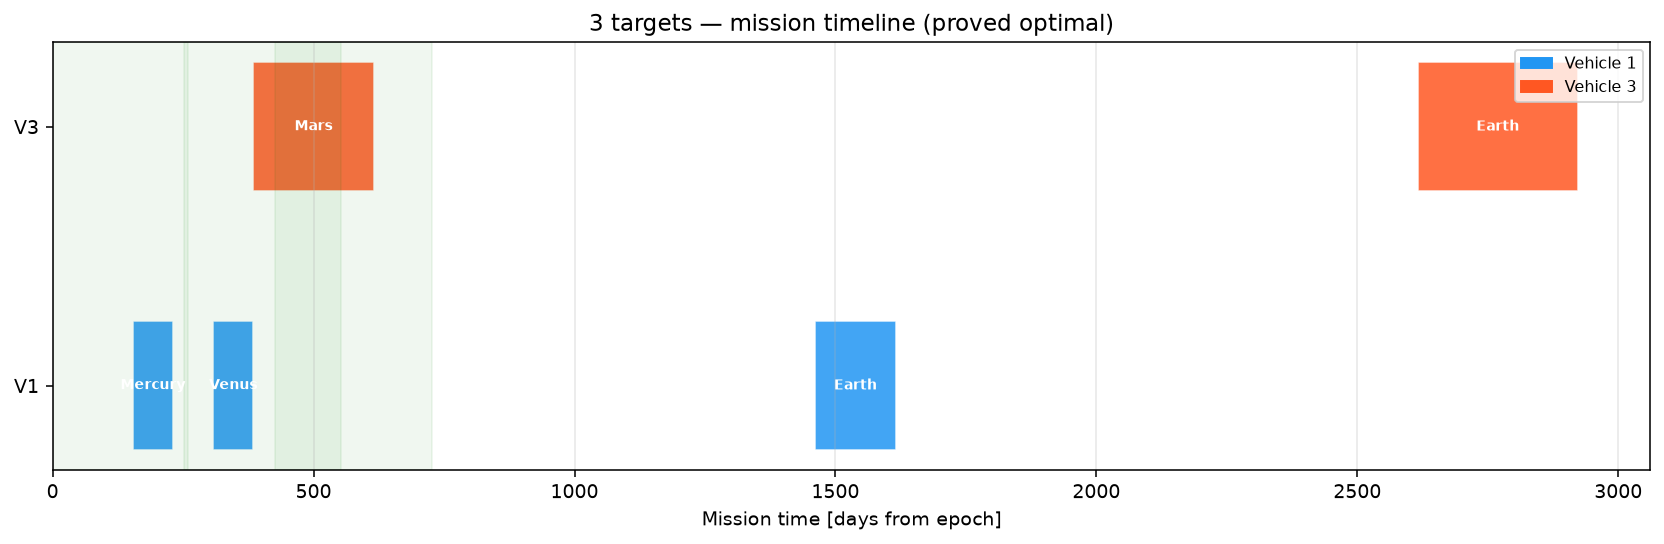
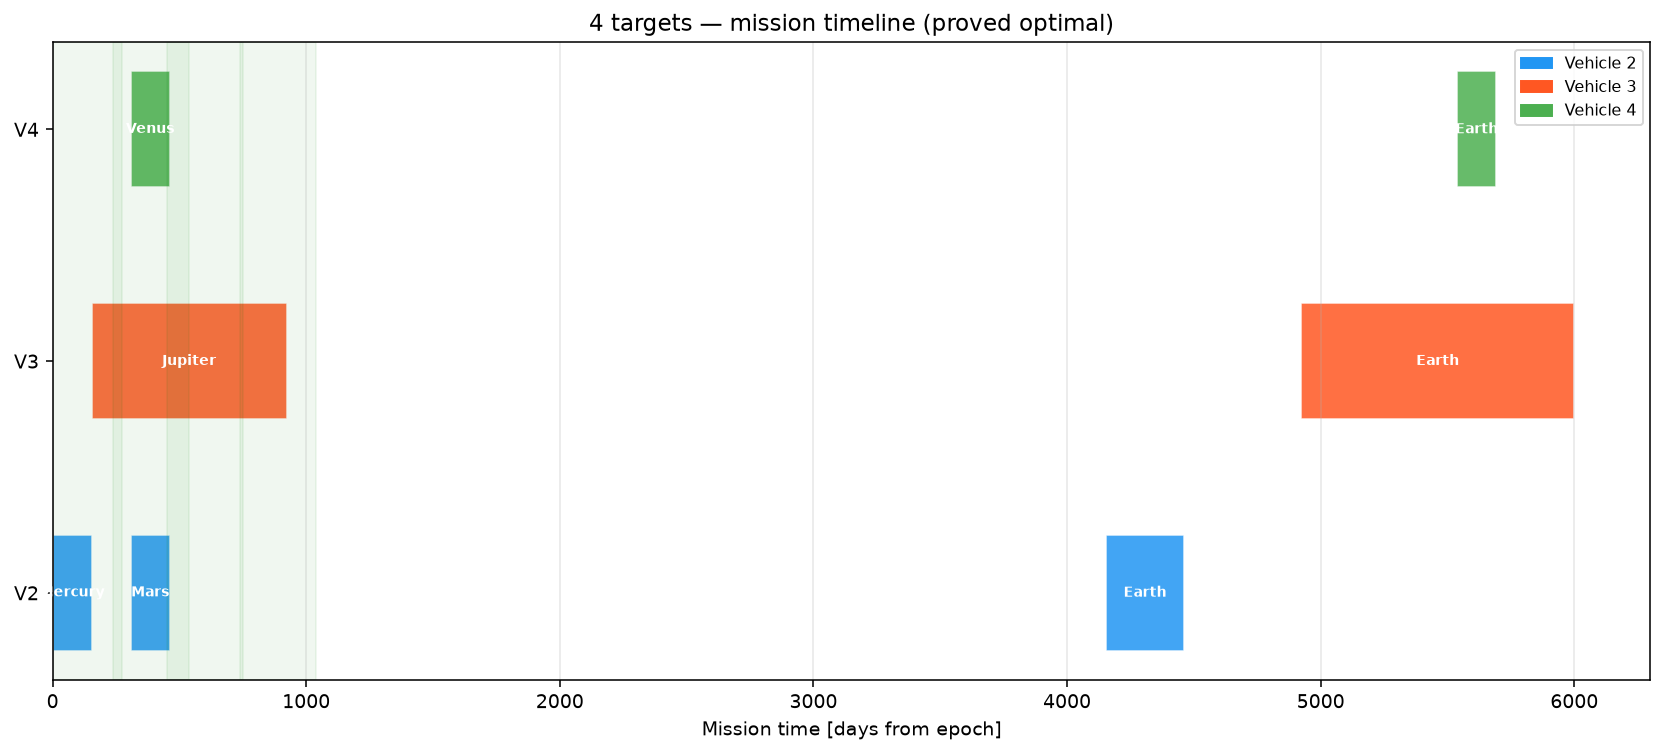
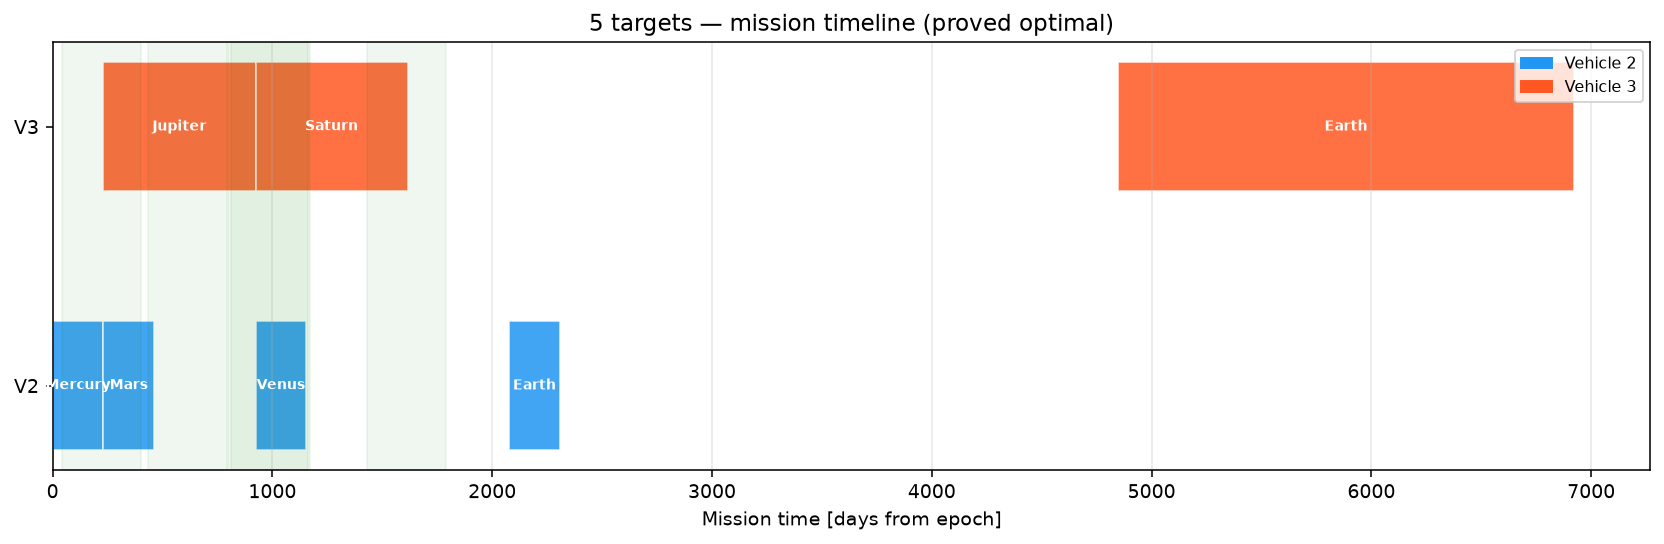
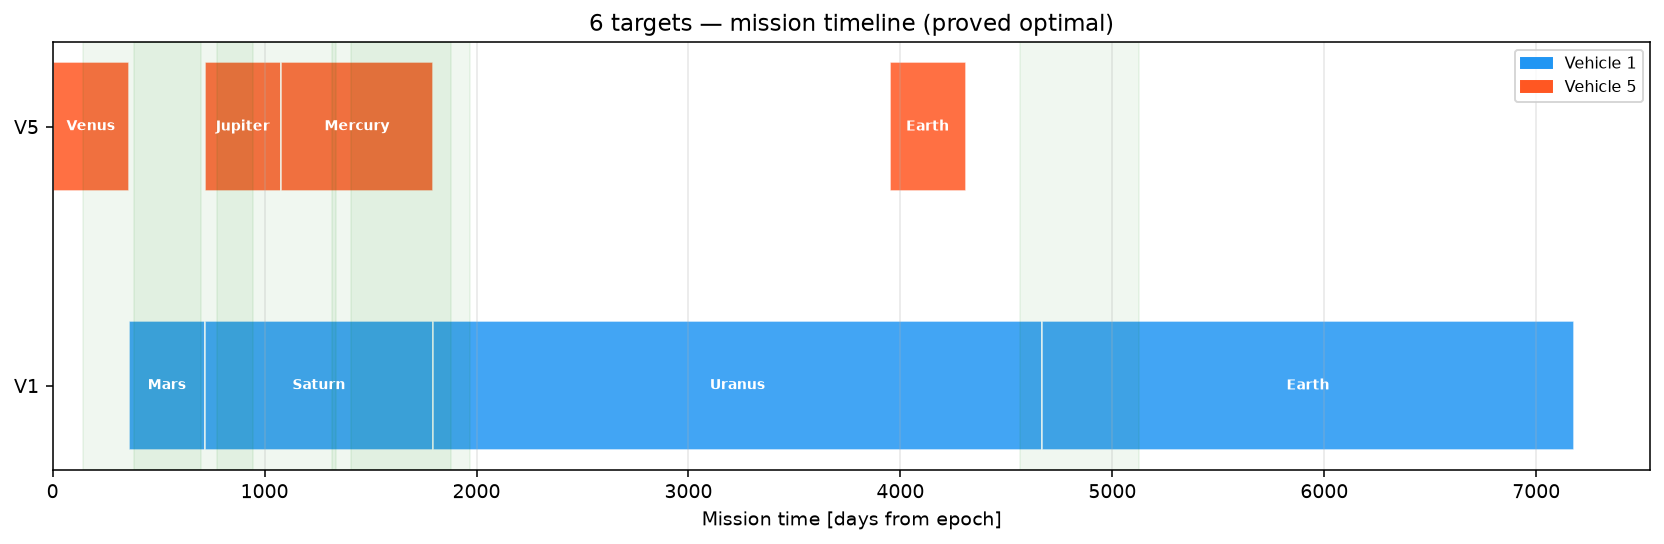
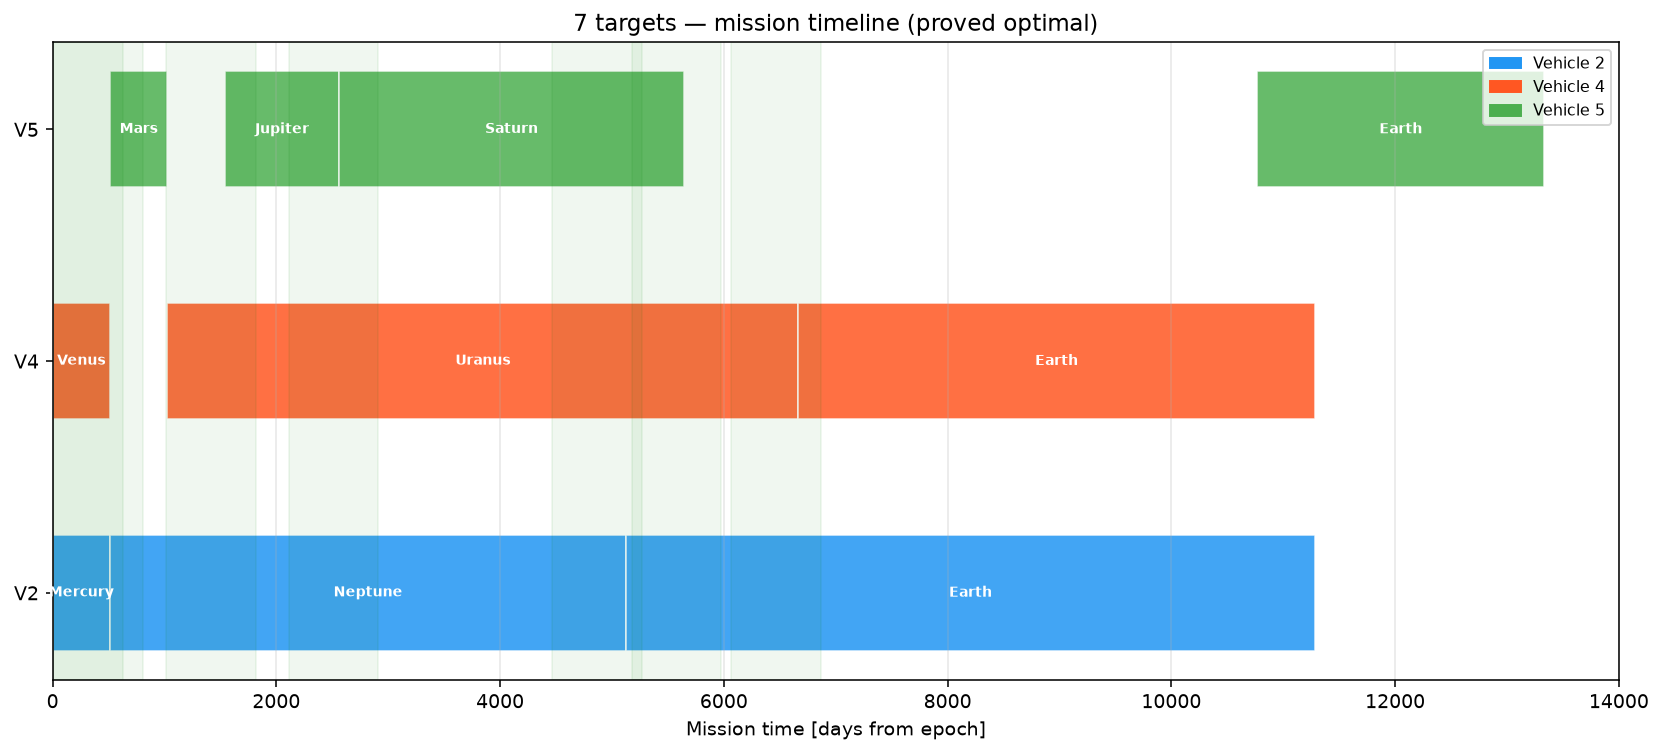
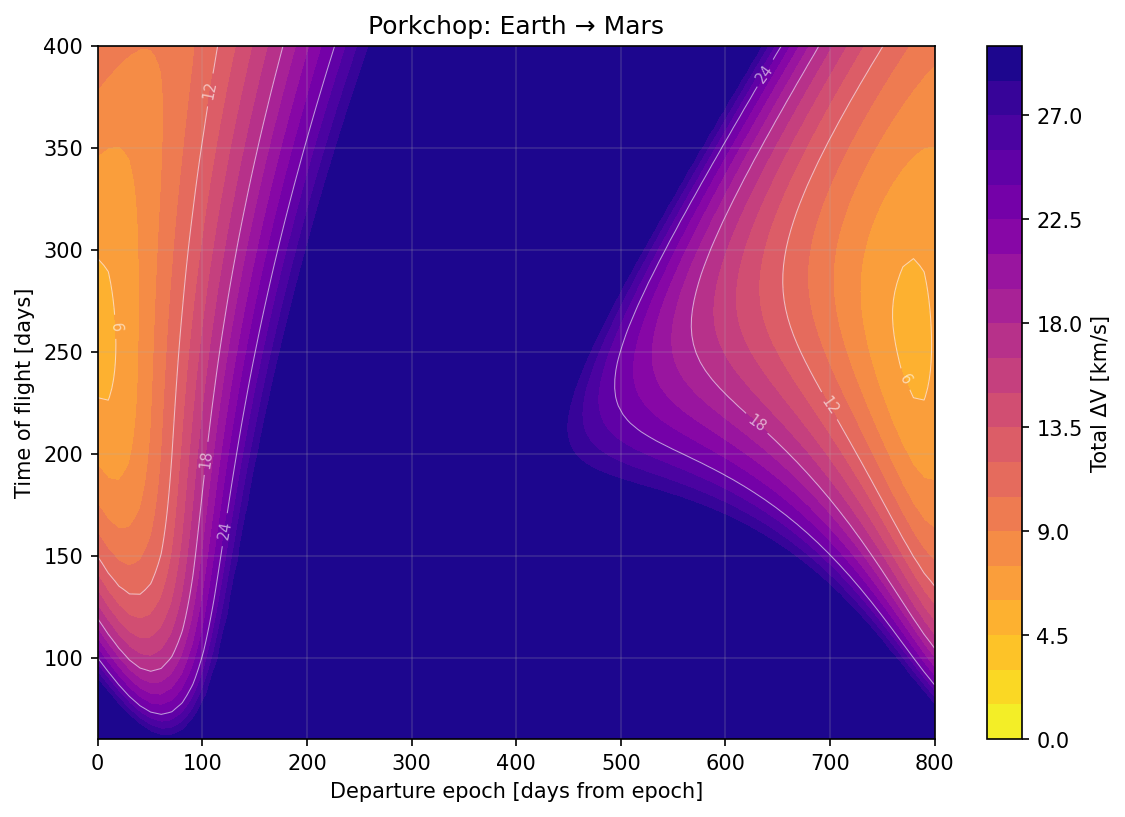
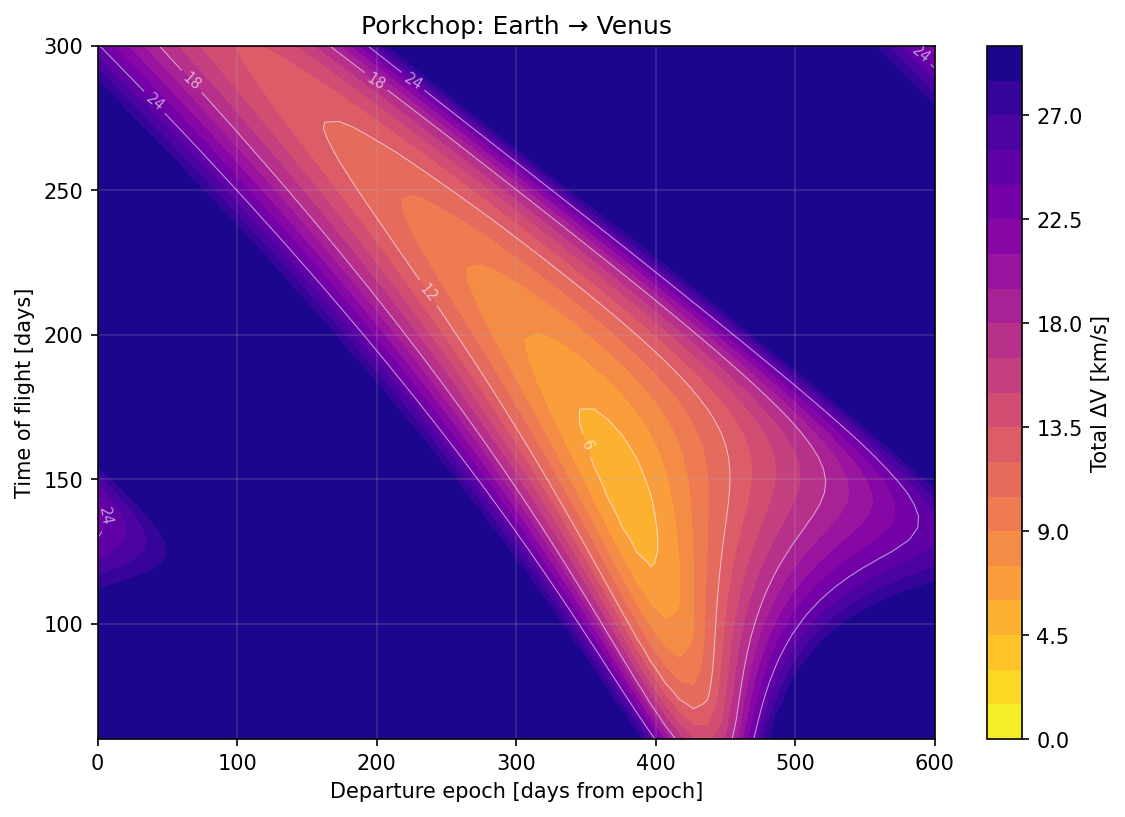
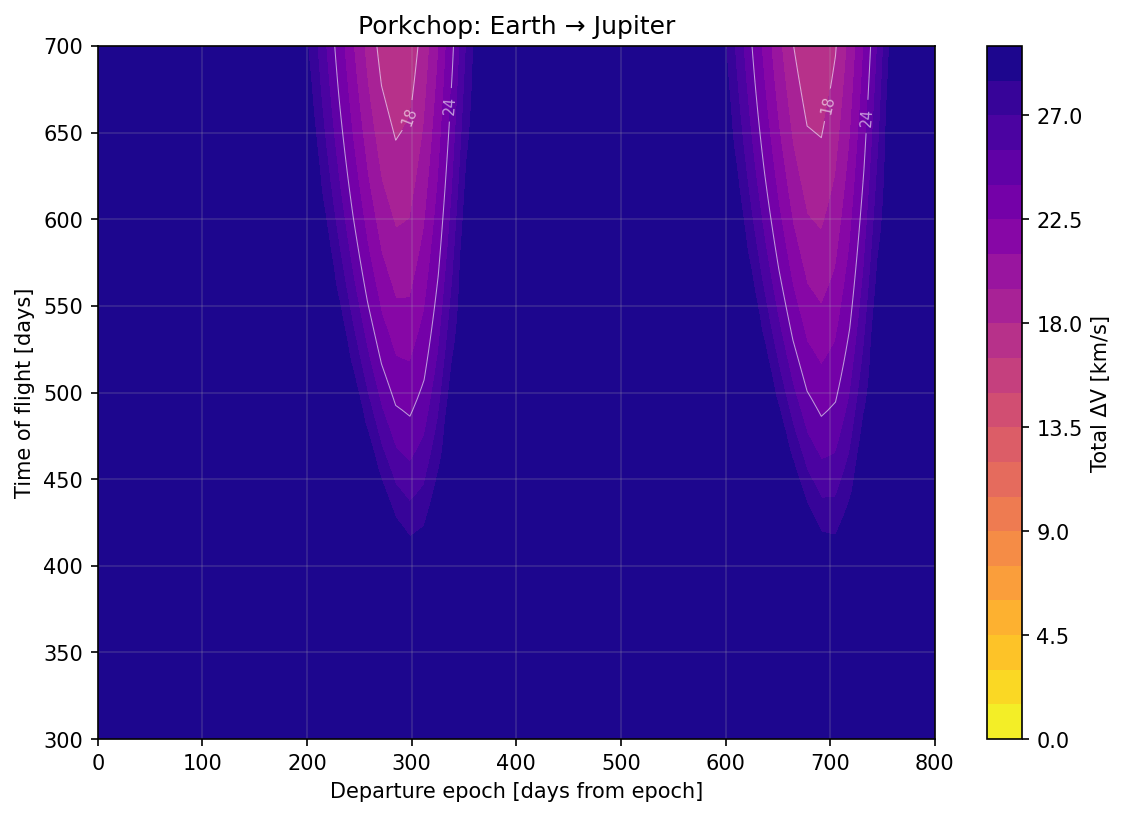
Provenance. Solved with exact MILP (HiGHS via scipy.optimize.milp) on a 40-epoch time-expanded grid. Optimality was proved, so these figures are the true optimum of the model, not a heuristic estimate. Per-spacecraft budget 170 km/s.
Caveat. The model prices every leg as a direct Lambert transfer with no gravity assists, and requires each spacecraft to return to Earth. Real grand tours buy most of their Delta-v from planetary flybys, so these totals sit well above a flown mission profile.
Route Summary — 7-Target Instance
| From | To | Depart (d) | TOF (d) | Δv (km/s) |
|---|---|---|---|---|
| Earth | Mercury | 0.0 | 512.8 | 119.123 |
| Mercury | Neptune | 512.8 | 4615.4 | 28.783 |
| Neptune | Earth | 5128.2 | 6153.8 | 19.792 |
| From | To | Depart (d) | TOF (d) | Δv (km/s) |
|---|---|---|---|---|
| Earth | Venus | 0.0 | 512.8 | 23.939 |
| Venus | Uranus | 1025.6 | 5641.0 | 19.941 |
| Uranus | Earth | 6666.7 | 4615.4 | 16.456 |
| From | To | Depart (d) | TOF (d) | Δv (km/s) |
|---|---|---|---|---|
| Earth | Mars | 512.8 | 512.8 | 12.193 |
| Mars | Jupiter | 1538.5 | 1025.6 | 12.021 |
| Jupiter | Saturn | 2564.1 | 3076.9 | 19.991 |
| Saturn | Earth | 10769.2 | 2564.1 | 15.983 |
Visualisations